PiWeb-Formplots
Circle plot

Description
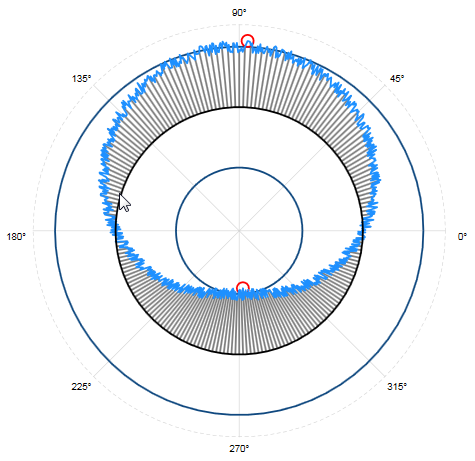
The circle plot displays deviations from a nominal circle.
Point structure
- Angle (radians)
- Deviation
The deviations are assumed to be in normal direction to their position respective to the circle, which is specified by the angle.
Geometry
Although the circle plot geometry has a radius parameter, it has no effect for displaying the plot.
Example
var plot = new RoundnessPlot();

var segment = new Segment<CirclePoint, CircleGeometry>( "All", SegmentTypes.Circle );
plot.Segments.Add( segment )

var rand = new Random( DateTime.Now.Millisecond );

for( var i = 0; i < count; i++ )
{
	var angle = ( double ) i / count * 2.0 * Math.PI;
	var deviation = 0.1 * ( Math.Sin( angle ) + ( rand.NextDouble() - 0.5 ) * 0.2 );

	var point = new CirclePoint( angle, deviation );

	segment.Points.Add( point );
}

plot.Tolerance = new Tolerance( -0.1, 0.1 );
plot.DefaultErrorScaling = 100;
Remarks
- The plot points are connected in the order of their appearance, and not sorted by their angle.