PiWeb-Formplots
Fourier plot

Description
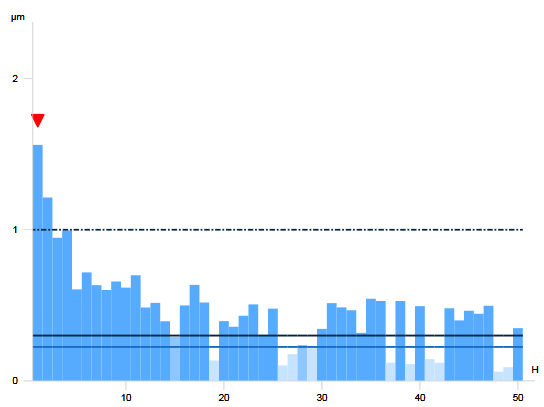
The Fourier plot displays amplitudes, presented as equidistant bars on a bar chart, over corresponding harmonics.
Point structure
Fourier points consist of…
- Harmonic (uint stored in Network Byte Order (Big Endian))
- Amplitude
Example
var plot = new FourierPlot();

var segment = new Segment<FourierPoint, EmptyGeometry>( "All", SegmentTypes.None );
plot.Segments.Add( segment );

var rand = new Random( DateTime.Now.Millisecond );

// Harmonics are greater or equal to 1
for( uint harmonic = 1; harmonic <= count; harmonic++ )
{
	//No negative amplitudes
	var amplitude = ( 1.0 / (1.0 + ( double )harmonic / 1 ) + rand.NextDouble() * 0.2 ) * 0.0025;
	var point = new FourierPoint( harmonic, amplitude ) { Tolerance = new Tolerance( null, 0.0003 ) };

	segment.Points.Add( point );
}
Remarks
- Be aware that the harmonic is stored as an unsigned integer value in network byte order (big endian) and its value must be greater than 0
- The amplitudes must be greater or equal to 0