PiWeb-Formplots
Line profile plot

Description
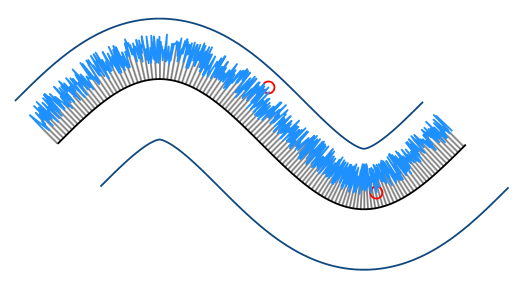
The line profile plot is a two dimensional presentation of custom curves and shapes with single measurement points or scanned measurement data.
Point structure
- Position (3D)
- Direction (3D)
- Deviation
While the points are specified as three dimensional entities, the plot displays them in a two dimensional projection plane. The plane is either selected automatically, or specified in the PiWeb Designer.
Example
var plot = new CurveProfilePlot();

var segment = new Segment<CurvePoint, CurveGeometry>( "All", SegmentTypes.None );
plot.Segments.Add( segment )

var rand = new Random( DateTime.Now.Millisecond );

var lastPosition = new Vector();

for( var i = 0; i < count; i++ )
{
	var angle = ( double ) i / count * 2.0 * Math.PI;

	var deviation = 0.025 + 0.05 * rand.NextDouble();

	var x = angle;
	var y = Math.Sin( angle ) + 2.0;

	var position = new Vector( x, y );
	var direction =  new Vector( -( position.Y - lastPosition.Y ), position.X - lastPosition.X );

	lastPosition = position;

	if( i == 0 )
		continue;

	var point = new CurvePoint( position, direction, deviation );

	segment.Points.Add( point );
}

plot.Tolerance = new Tolerance( -0.1, 0.1 );
plot.DefaultErrorScaling = 100;