PiWeb-Formplots
Pattern plot

Description
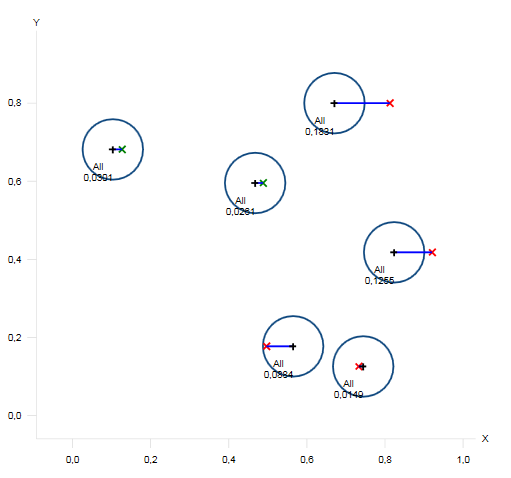
The pattern plot displays single deviations in a plane. Around each point, a tolerance area is drawn. Use the tolerance types Rectangular or Circular to define the dimensions of the areas. Rectangular tolerances are always aligned to the coordinate axis.
Points
- Position (3D)
- Direction (3D)
- Deviation
While the points are specified as three dimensional entities, the plot displays them in a two dimensional projection plane.
Example
var plot = new BorePatternPlot();

var segment = new Segment<CurvePoint, CurveGeometry>( "All", SegmentTypes.None );
plot.Segments.Add( segment );

var rand = new Random( DateTime.Now.Millisecond );

for( var i = 0; i < count; i++ )
{
	var x = rand.NextDouble();
	var y = rand.NextDouble();
	var deviation = ( rand.NextDouble() - 0.5 ) * 0.2;

	var point = new CurvePoint( new Vector( x, y ), new Vector( 1 ), deviation );

	segment.Points.Add( point );
}

plot.Tolerance = new Tolerance
{
	ToleranceType = ToleranceType.Circular,
	CircularToleranceRadius = 0.1
};

plot.DefaultErrorScaling = 100;