PiWeb-Formplots
Pitch plot

Description
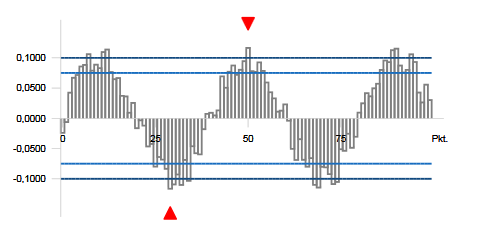
The pitch plot shows single deviations, presented as equidistant bars on a bar chart. Unlike the line plot, the pitch plots axis has no dimension, but displays the point index instead.
Point structure
- Position (int)
- Deviation
Please note that the Position parameter will not be serialized and therefore doesn’t have to be set. Instead, the array index is used. The Position can be used to identify a point out of the lists context.
Example
var plot = new PitchPlot();

var segment = new Segment<PitchPoint, PitchGeometry>( "All", SegmentTypes.Line );
plot.Segments.Add( segment );

var rand = new Random( DateTime.Now.Millisecond );

for( var i = 0; i < count; i++ )
{
	var deviation = 0.1 * ( Math.Sin( i * 0.05 * Math.PI ) + ( rand.NextDouble() - 0.5 ) * 0.5 );

	//The pitch point has a position property, but it won't be written. Instead, the point order matters.
	var point = new PitchPoint( deviation );

	segment.Points.Add( point );
}

plot.Tolerance = new Tolerance( -0.1, 0.1 );
plot.DefaultErrorScaling = 100;