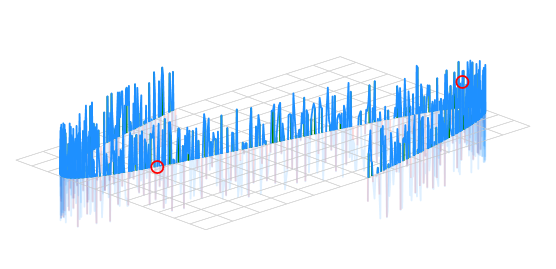
PiWeb-Formplots
Plane plot

Description
The plane plot shows deviations on a plane in the planes normal direction. The plane is usually displayed in an isometric perspective.
Point structure
- Position Axis 1 (1D)
- Position Axis 2 (1D)
- Deviation
Unlike in other plots, the position coordinates are specified separately. Make sure the points don’t form a straight line, as the plot will not display them in this case. If you want to display a line on purpose, use the line plot.
Geometry
The actual geometries parameters Length1 and Length2 are multiplied with the points respective coordinate ranges to define dimensions of the plot. By specifying a different value for Length1 and Length2, the displayed plot can be stretched.
Example
var plot = new FlatnessPlot();

var segment = new Segment<PlanePoint, PlaneGeometry>( "All", SegmentTypes.Line );
plot.Segments.Add( segment );

var rand = new Random( DateTime.Now.Millisecond );

//The plot point coordinates will be multiplied with the length values when the plot is displayed.
plot.Actual.Length1 = 5.0;
plot.Actual.Length2 = 1.0;

for( var i = 0; i < count; i++ )
{
	var share = ( double ) i / count;
	var x = Math.Sin( share * 2.0 * Math.PI );
	var y = share * 2.0 * Math.PI;

	var deviation = ( rand.NextDouble() - 0.5 ) * 0.2;

	var point = new PlanePoint( x, y, deviation );

	segment.Points.Add( point );
}

plot.Tolerance = new Tolerance( -0.1, 0.1 );
plot.DefaultErrorScaling = 100;
Remarks
- Currently, the plot can’t display tolerances.
- The plot points must not lay in one line.